Market: SEA, Indonesia, Brazil, Turkey, South Africa, USA, India
About Project
CD Cockpit is an embodiment of critical tools and capabilities, enabling the “Power of one” with personalized & simplified data stories, insights, and automation initiatives from a data and analytics lens.
This tool helps streamline the entire process of identification of pain points, their root cause analysis and solutioning. It also allows for training & transferring knowledge of tools to all users.
User Persona
Meet Camila, our CSP overseeing Growth Strategy, Commercial Plans, Innovation, Integration, and Core Capabilities. Given the diverse demands of her role, she transitions between various responsibilities throughout her day. However, this agility also entails her to frequently access KPIs and capabilities from different sources and platforms, which at times can become overwhelming for her.
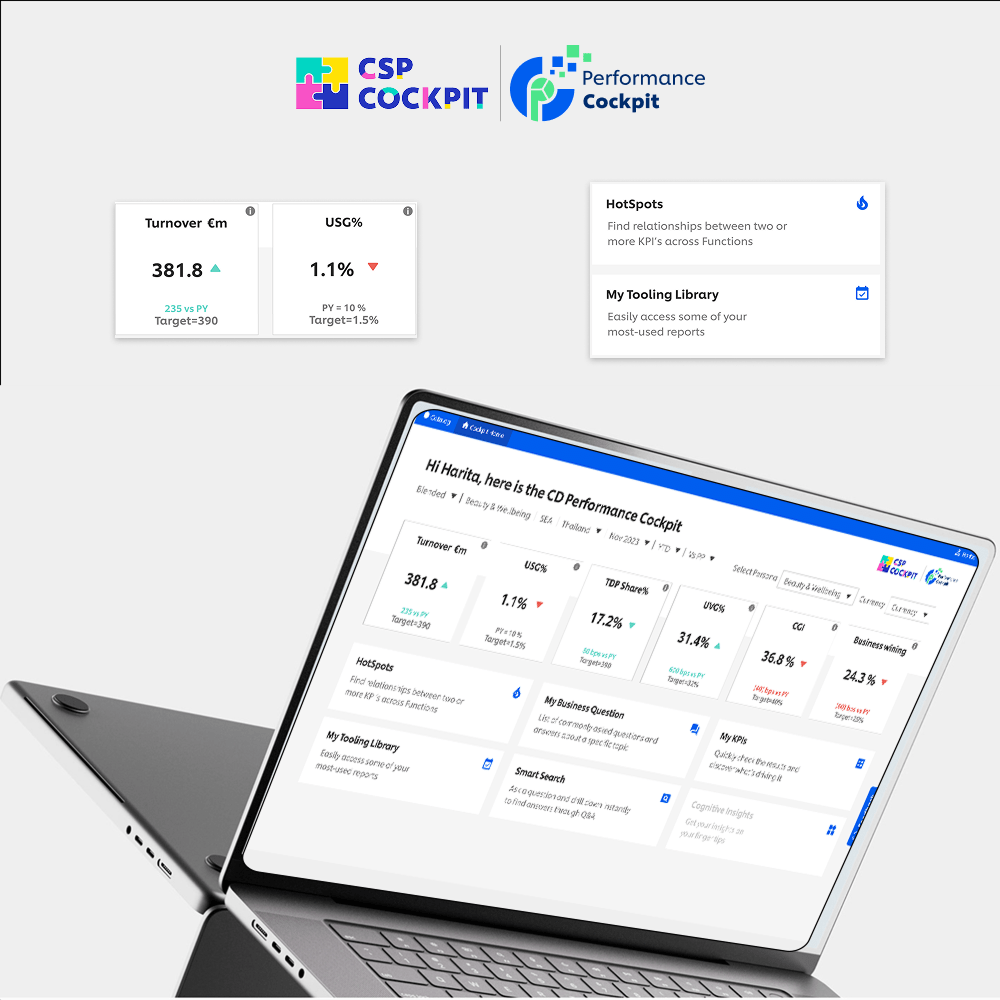
To begin, Camila aims to get a holistic understanding of the performance across different BGs/ markets. Rather than navigating through numerous sources and platforms, she finds simplicity in opening the CD Cockpit dashboard.
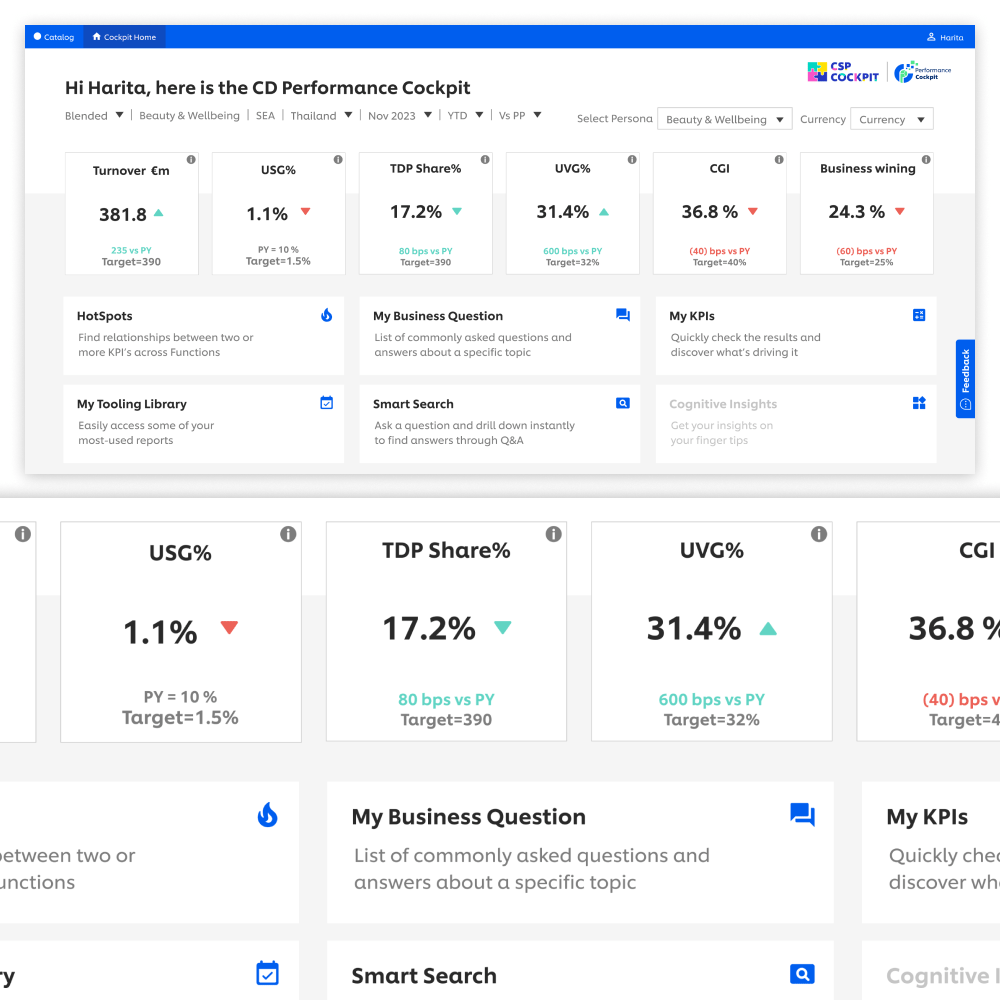
Upon landing on the dashboard, she’s delighted to discover all the most pertinent and critical KPIs presented, right on the landing page. These KPI cards also offer insights into metric growth trends relative to the previous year-to-date (PY-MTD), based on KPI definitions.
My KPIs
Now, Camila wants to have a look at few other metrics which were not displayed on the landing page. Hence, she goes to the ‘My KPIs’ section which houses all KPIs (across NRM, CGI and S&OP) in one place under their respective pillars.
For instance, as shown in the video, she finds a red downtick in the Turnover card. This indicates that compared to today, ‘Home Care’ in ‘Europe’ was doing better in terms of turnover around this time in the previous year. She can easily navigate to the KPI of interest by clicking on its card.
Problem Statement
Camila has identified the problem, she wants to understand the root cause behind this.
Solution - Hotspot
She can do the Root Cause Analysis by using ‘HotSpots’ feature
Now that Camila has pinpointed the problem, she aims to conduct a root cause analysis to determine what needs immediate attention and rectification. To do this, she clicks on the ‘Hotspots’ section. This segment enables her to comprehensively examine various KPIs across BU, Country or Category.
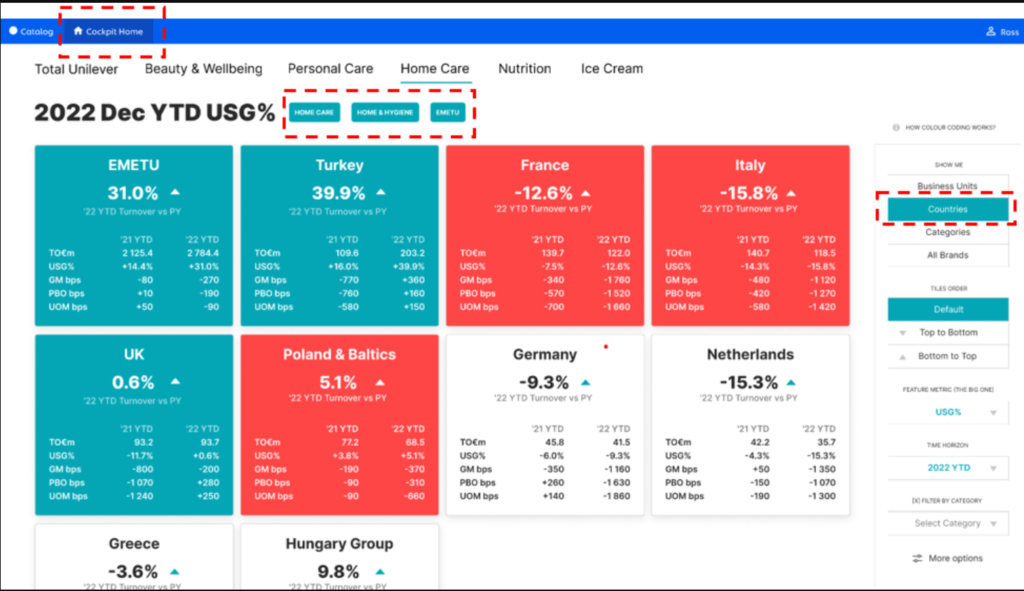
Video below shows a BU-level view of HotSpots page. The KPI cards are color-coded on the basis of their performance:
As demonstrated, Camila successfully narrows down the issue from ‘Home Care’ to ‘Home & Hygiene,’ then further to ‘EMETU,’ and finally to the specific countries where the problem persists.
To return to the main landing page, Camila can easily click on the ‘Home’ option located at the top.
Problem Statement
Camila has few questions on her mind (Which pack size/format is not doing well? Are we paying our employees good enough? etc.).
She gets these queries answered using the ‘My Business Question’ feature
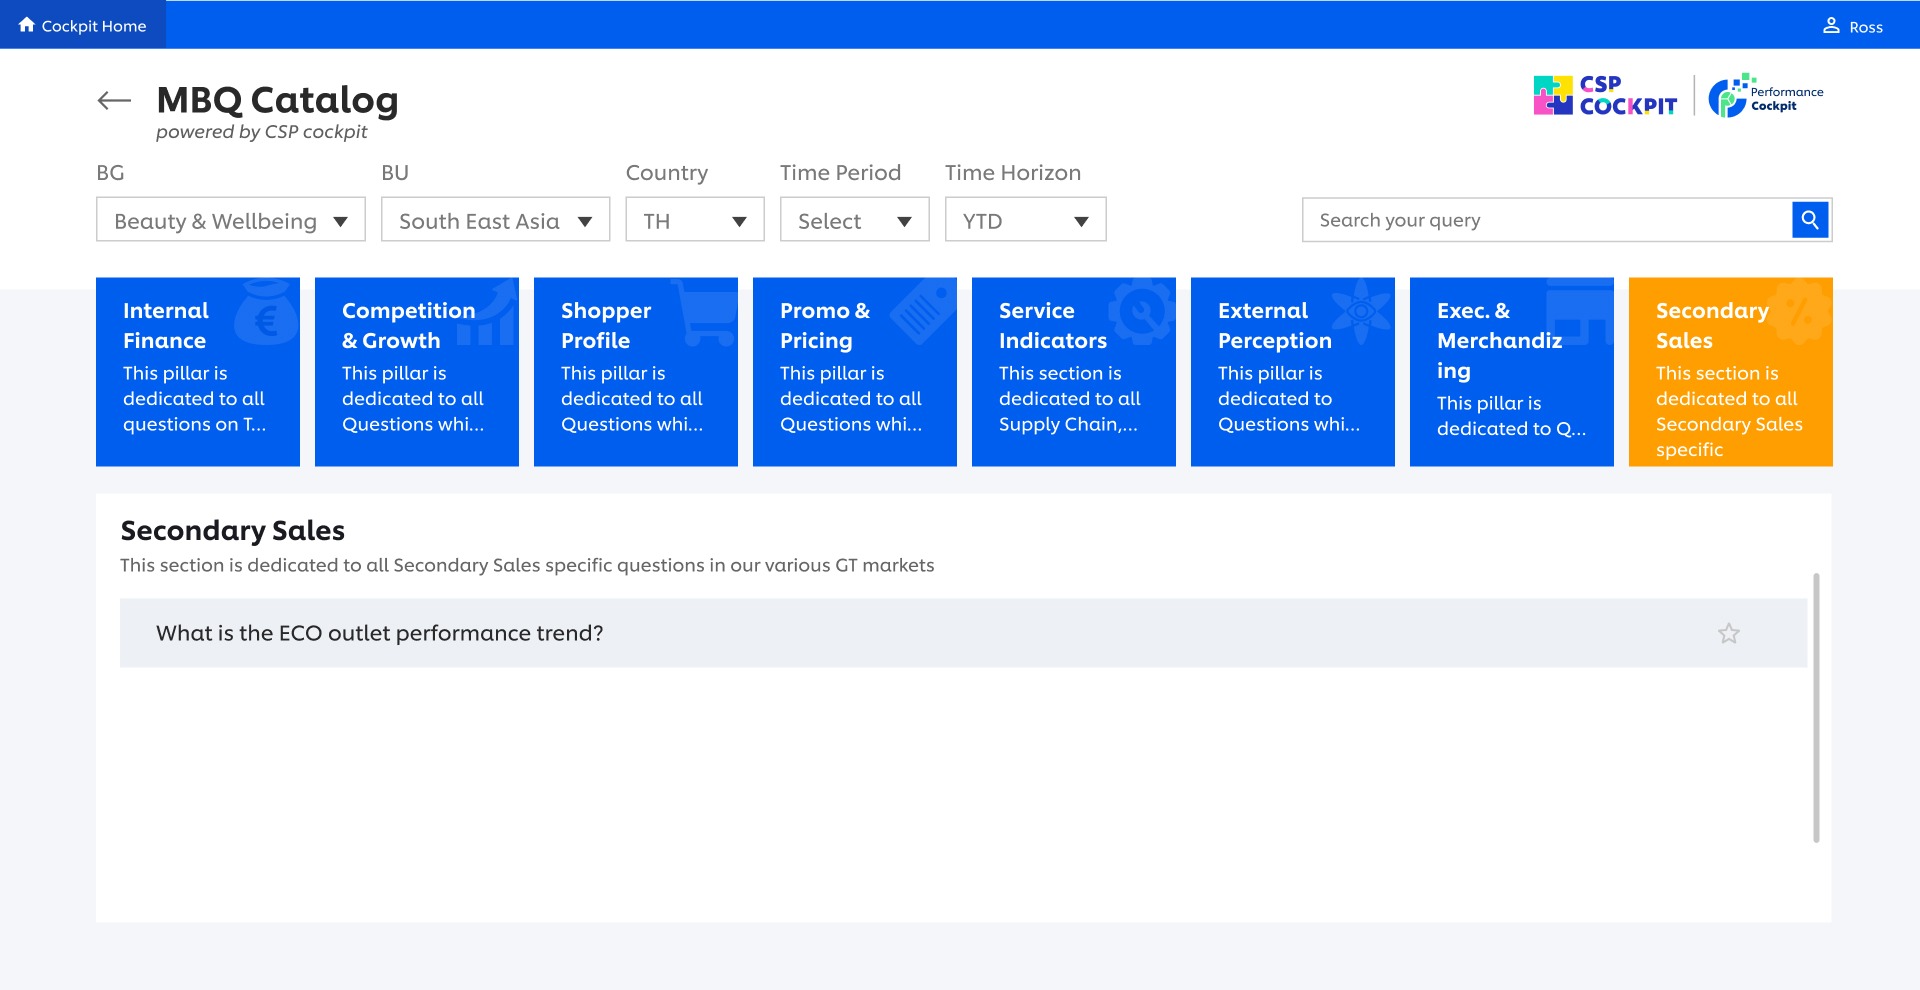
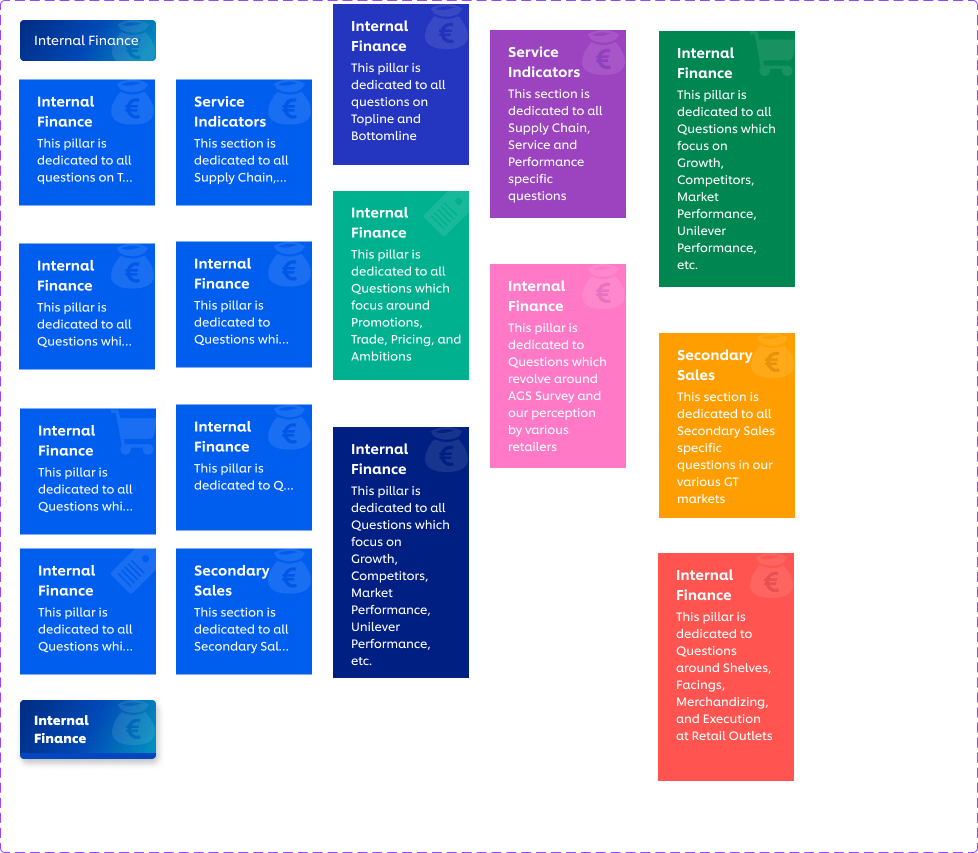
Solution - MBQ (My Business Question)
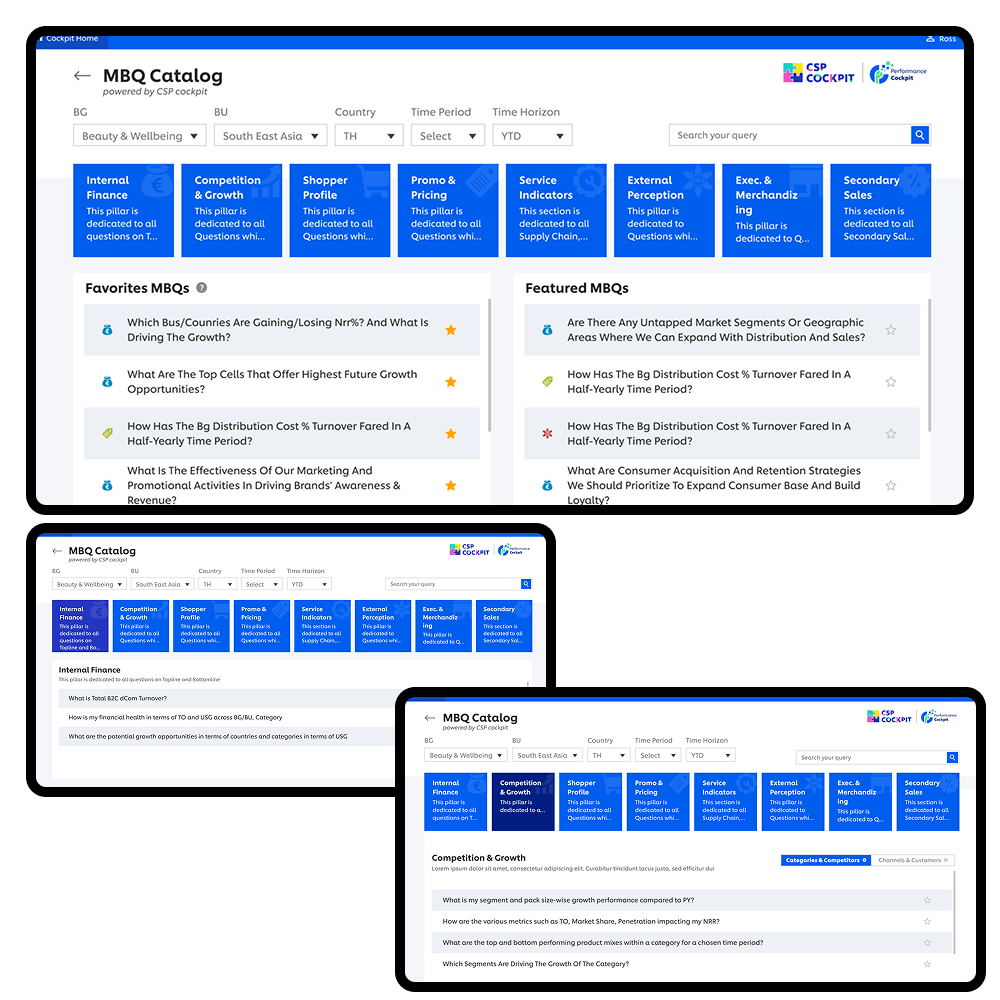
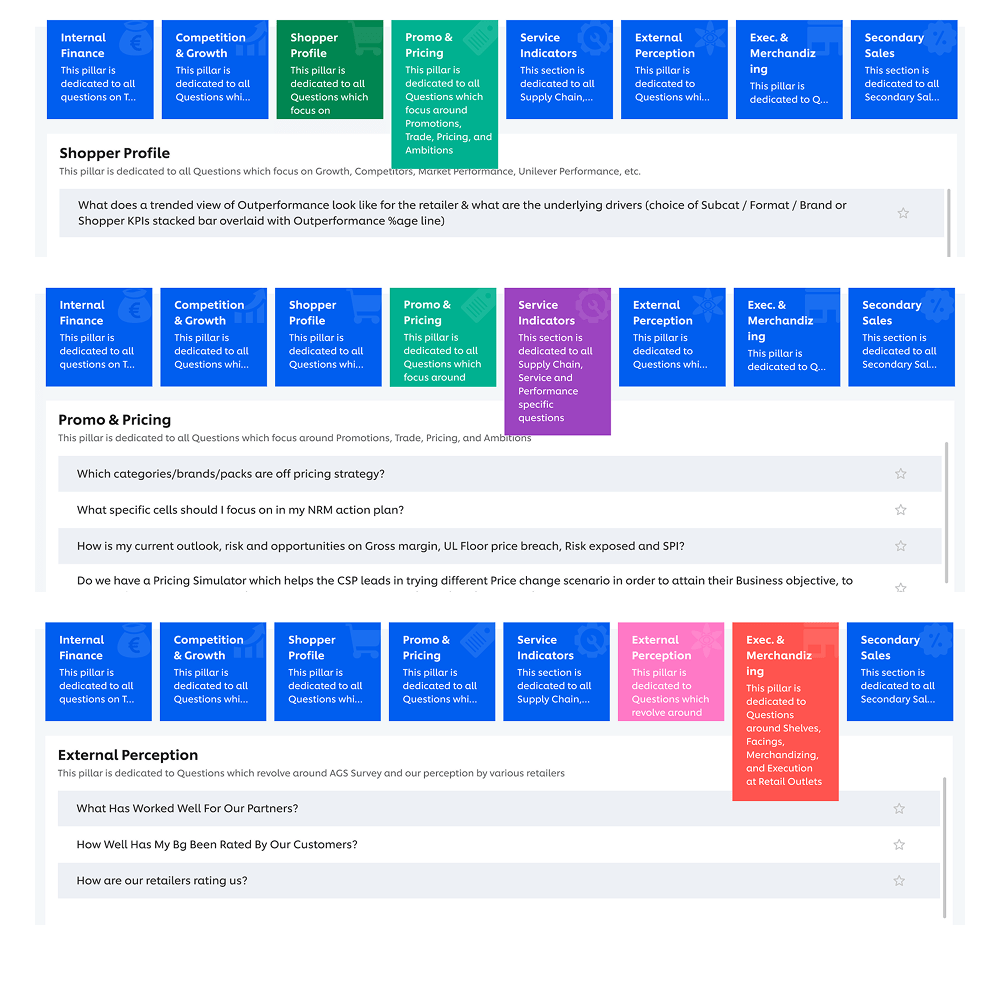
Now imagine, Camila has some business-related queries in her mind. She navigates to the ‘My Business Question’ section where she discovers a compilation of common business queries that she generally has, along with their corresponding answers.
MBQ page presents her a thoughtfully curated inventory of business questions, designed to assist businesses in solving their day-to-day challenges. By selecting any given question, she can access an infographic dashboard, sourced from an existing capability.